Obtaining data is one thing, but ensuring that data is clean is another challenge altogether.
HBR revealed that bad and dirty data costs US businesses some $3 trillion a year, and Experian similarly found that dirty data affected the bottom line of 91% of respondents.
Dirty data can derail data science projects and affect many data-driven systems and technologies. Bad data skews analytics, leading to wrong decisions and poor insight. If bad data is used to build technologies and applications, those technologies might fail to reach their potential.
For machine learning and AI, dirty data can influence the performance and outcomes of models. Dirty data can even lead to non-compliance or legal and regulatory issues in some situations.
Collecting clean data at the outset of a data science project should always be a maximum priority. But, this isn’t always possible and dirty data is often uncovered sometime after data has already been collected.
As we can see below, data should be clean and ready to go at the very start of the data value chain.
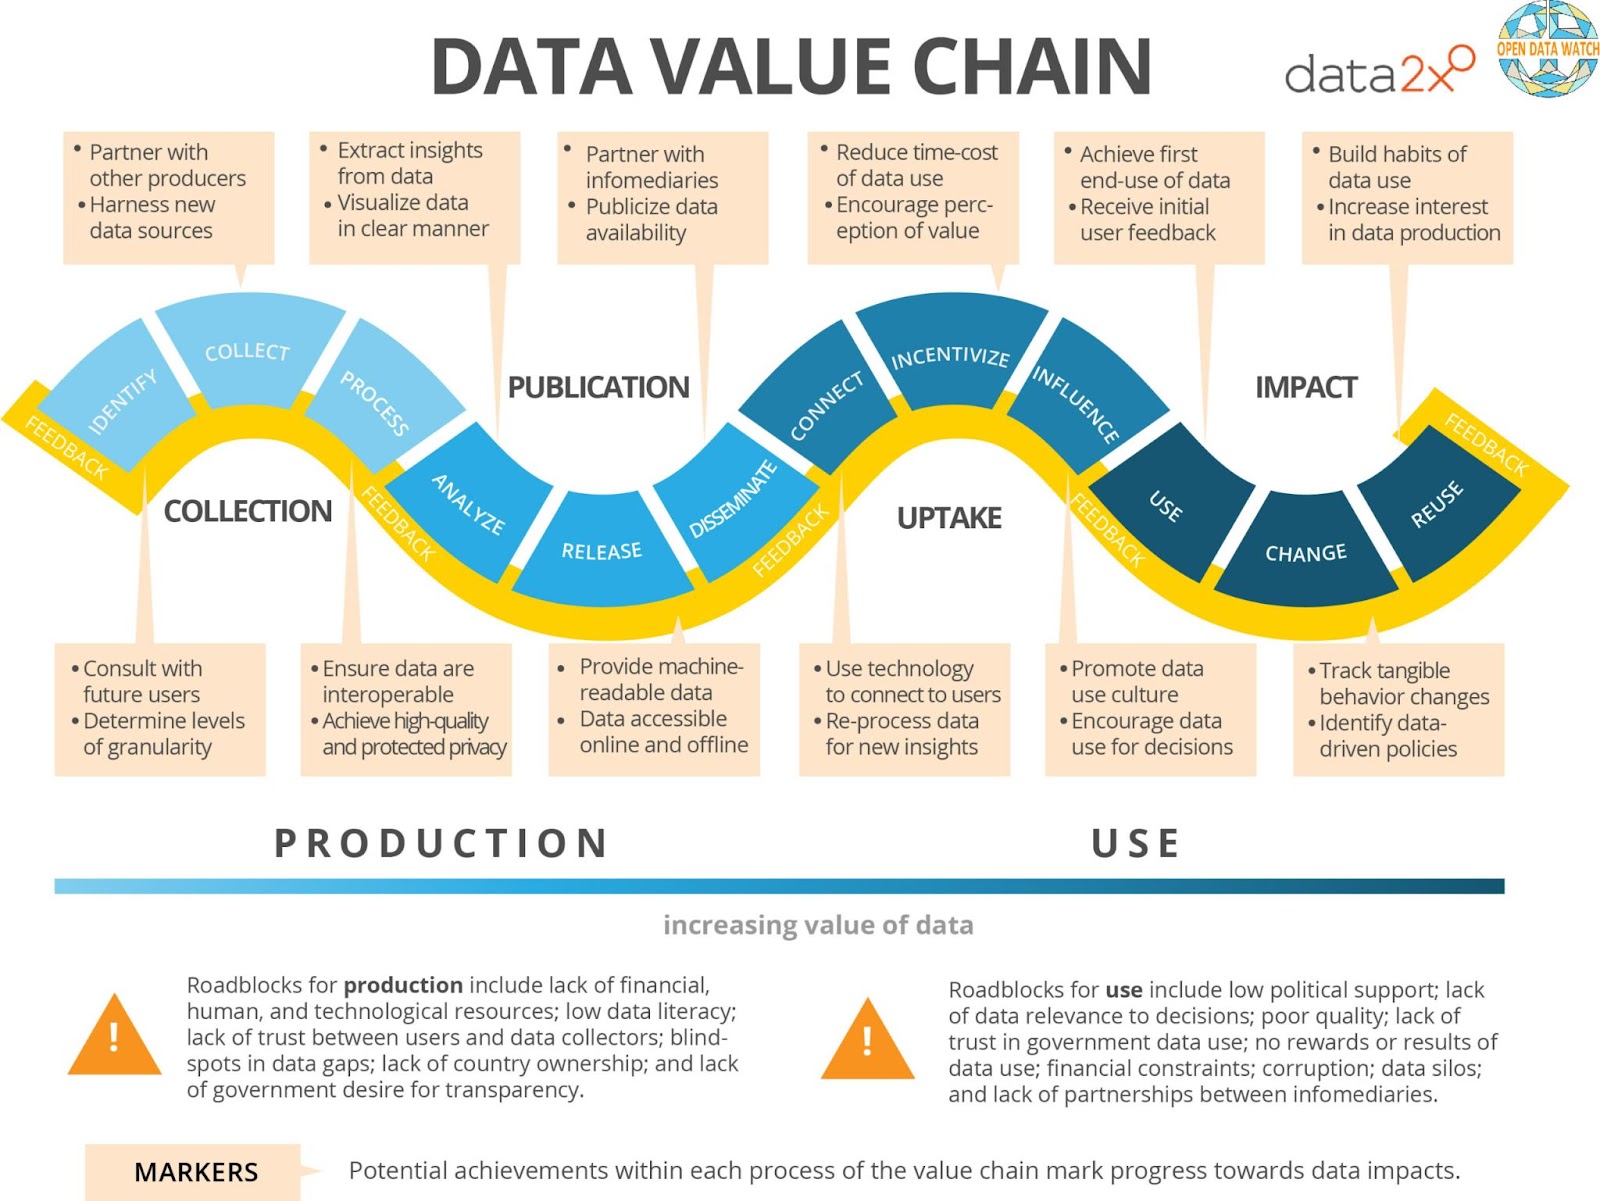
Pretty much every aspect of the data value chain relies on clean, quality data – it’s absolutely fundamental.
As such, it’s essential to know how to clean data. This is a guide to cleaning data.
Table of Contents
Part 1: Four Characteristics of Quality Data
First and foremost, what does good quality data actually look like? Quality data should adhere to four main characteristics:
- Accuracy
- Completeness
- Consistency
- Validity
1: Accuracy
The accuracy of data is dependent on so many variables. For example, if data is collected from human inputs, accuracy relies on whether or not the individual has input the correct data. If data is collected from IoT sensors, accuracy relies on those sensors being calibrated properly.
Even then, data accuracy can be skewed by temporary or discrete changes that are hard to detect.
Where possible, it’s essential to cross-check data for feasibility and accuracy. For example, data ingested through IoT sensors should be checked against manual measurements taken on-site (aka. ground-truthing). Some readings will be so inaccurate that they’ll be unfeasible, e.g. when someone enters a distance of 150m rather than 150cm.
2: Completeness
Data should be deemed ‘complete’ before using it in any serious way.
This is especially important in SEO or traffic in sales. When you’re first trying to rank a site or sell products and get traffic, you might only have a few bits and pieces of data to work with. So before investing heavily in marketing, tweaking customer personas, etc, it’s best to remain patient and wait until the data is ‘complete’.
Another example of when completeness is paramount is machine learning. When creating a training dataset, the dataset should be complete enough to cover the entire problem space. So, training an autonomous vehicle will require different datasets for driving on a clear day, a misty day, a rainy day, etc, as well as containing all the different features the vehicle will come across on the road.
3: Consistency
Data should be recorded consistently. However, consistency is often an issue when there are many different ways to collect the same data. For example, if you’re recording the number of times a person passes a certain street advert, it’d be non-sensical to record passes per minute on one day and passes per hour another day.
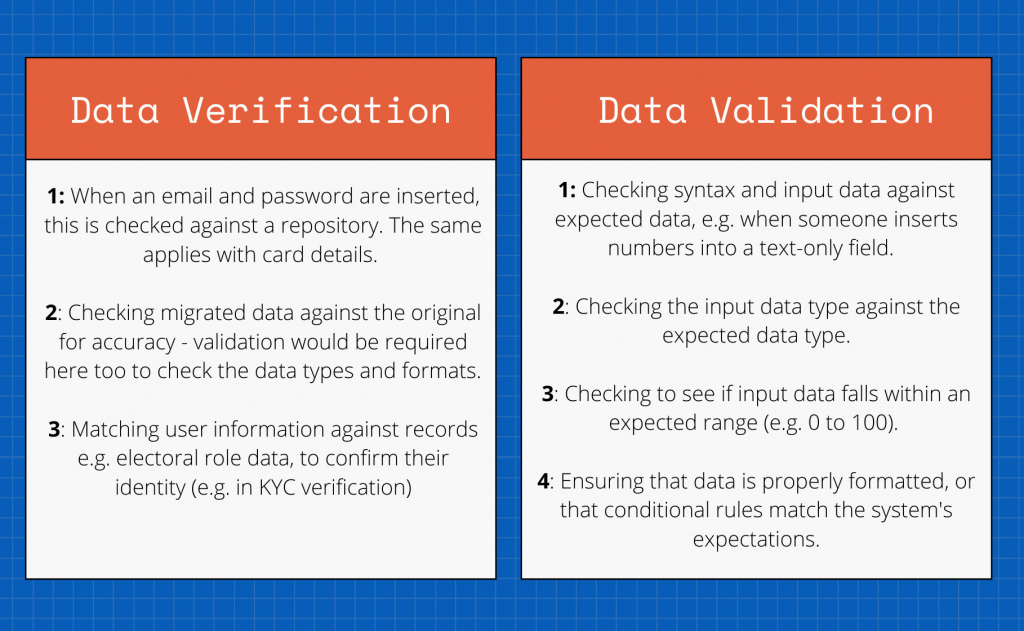
4: Validity
Data should be checked for validity, ensuring the data being passed into a database or system complies with what that database or system expects.
There are many ways to ensure data validity at ingestion, such as setting field constraints (e.g. ensuring a date is written in a particular format), key constraints, where data is limited to pre-defined keys and data type constraints, where data is rejected if it doesn’t comply with a pre-determined datatype.
Part 2: What is Dirty or Bad Data?
There are many types or examples of dirty or bad data. Knowing how to spot dirty or bad data is a lifelong data science skill!
Here are the six most significant sources of dirty and bad data:
1: Duplicate Data
An extremely common form of dirty data. Duplicate data occurs from data exchanges, migrations, imports and data ingestion from 3rd party connectors.
If too many duplicates are ingested into, say, a CRM like Salesforce, this could skew analytics and metrics. If datasets with duplicates are used to train models or are used as a target for exploratory data analysis, the results will be false.
- Duplicate data pollutes datasets
- Marketing budget spent on duplicates is wasted
- Ruins the possibility of obtaining a single customer view
- Hinders personalisation and predictive analytics
2: Outdated Data
Outdated data is not always an issue unless its age negatively impacts its usefulness in the present day. However, it’s nonsensical to build data technologies that use data from the past for the present day.
Outdated data has resulted in biased outcomes for machine learning projects in some situations, as illustrated when Amazon decommissioned their recruitment AI for bias. In this example, Amazon’s training data was outdated and over-featured men in tech-based roles.
3: Non-Compliant Data
GDPR signified a paradigm shift in how businesses gain, use and maintain customer information. California’s Consumer Privacy Act (CCPA) and Maine’s Act to Protect the Privacy of Online Consumer Information are two other examples of privacy-affecting legislation.
Privacy law affects data integrity by regulating what data businesses can rightfully use with varying degrees of consent.
- Databases and data systems should be cleaned and consolidated for compliance
- Utilising non-compliant data could be a civil or even a criminal offence
4: Incomplete or Missing Data
It’s always the data you really need that turns out to be missing! Incomplete data is incredibly frustrating and ruins the integrity of other related data. For example, if a customer profile is missing contact details, what use is it for outbound marketing?
In machine learning, incomplete data makes it tricky to train an accurate model. For example, it’s nearly impossible to train an autonomous vehicle without training sets that cover everything the vehicle will encounter on the road – the dataset might feature many bicycles, but it is missing eScooters.
- Incomplete data renders related data useless
- Results in biased models
- Ruins the accuracy of analytics
Want to improve your data skills?
See the best data engineering & data science books
5: Inaccurate Data
Inaccurate data often results from poor manual entry and other human errors. For example, filling out the wrong field, or entering wrongly formatted data results in inaccuracies. The date is a prime example, as it can be written in multiple forms, e.g. MM/DD/YY or DD/MM/YY, etc.
Inaccurate data greatly impacts the success and quality of data science projects, and it’s often tricky to remedy. Data validation is important for reducing data inaccuracy, as are building robust data protocols and systems which reduce human error rates.
- Inaccurate data often results from human error and poor data validation
- Can be hard to nail down what data is right and wrong
- Crucial to build consistency and standardisation at ingestion to avoid fixing inaccurate data later on
6: Excessive Data
Despite Big Data being the norm, even amongst SMBs and smaller businesses, it’s still possible to collect too much data. Excessive data creates storage issues and makes it more arduous to generate quality insights.
In machine learning projects, it’s generally true that too much data is better than too little, but slimming down datasets and databases can be a shrewd economic choice.
- Excessive data makes multiple tasks tougher and more arduous
- There’s usually a cost:benefit trade-off when it comes to data quality
- For machine learning, data quality issues can’t be ironed out by simply adding more poor data to a bloated dataset
Part 3: Basic Data Cleaning Techniques
To handle dirty data, you’ll need to clean it. Here are seven basic data cleaning techniques for improving messy or dirty data. These techniques are by no means exhaustive – there are probably thousands of ways to go about cleaning data!
1: Remove Duplicates
Deduplication is the first port of call for handling dirty data. If you know you’re working with a database full of duplicates, this should be the first thing you do. There are various ways to check for duplicates, including sorting and filtering data by date, letter, etc, to see if the same data has been repeated (which is straightforward for customer data).
There are many ways to discover duplicates using SQL and many data products ranging from CRMs to CDPs have deduplication built-in.
Panda, a Python library for data manipulation, can also highlight and remove duplicates in practically any dataset.
To learn how to deduplicate keywords in Panda, check out this guide.
2: Remove Spaces and Syntax Errors
Removing spaces and syntax is another relatively simple data cleansing task required for strings.
In Excel, it’s as simple as using the trim function Syntax: =TRIM(Text). This is useful when preparing text for NLP. Removing spaces from a string using Python is also straightforward.
There are various ways to remove spaces, incorrect grammar, punctuation, etc, in Python using Pandas. Some advanced forms of NLP preprocessing include:
- Lemmatization
- Lower casing
- Removing punctuation
- Removing stop words
- Removing URLs
- Stemming
- Tokenization
3: Remove Irrelevant Data
Not all data you have will be relevant to a specific project. For example, scraping data can return all sorts of useless HTML, which should be removed before further processing. BeautifulSoup is excellent for removing HTML.
In addition, it may be necessary to remove URLs, boilerplate text, tracking codes and personally identifiable information (PII) to make data compliant and usable.
4: Converting and Reformatting Invalid Data
Invalid data should be ideally rejected or during data validation. Invalid data which percolates into a database can be converted and reformatted into valid data.
A key example of potentially invalid data is dates, which can be written using both words and numbers (e.g. June 6th). This format isn’t easily readable by computers, and should be converted into a date (e.g. 06/06). Pandas contains the function to_datetime() for this purpose.
Another example is converting Boolean values. For example, it might be necessary to convert Yes to TRUE and No to FALSE.
6: Standardisation
Numerical data and strings should be standardised concerning format and case.
Strings rarely require capitalisation unless they’re being used to train NLP algorithms for named entity recognition or similar. Most of the time, strings should be in lower case only.
It’s also essential to standardise measurements, e.g. if a dataset contains durations written in both minutes and seconds (1m50s) or seconds (110s), different measurements (cm vs mm), etc.
7: Scaling
Sometimes, scales should be converted into percentages (0 to 100). For example, if there are five evenly distributed grade boundaries for a class test, listed as A, B, C, D and E, these would be better expressed as percentages.
Part 4: Handling Missing Values
Handling missing data is somewhat of a different beast compared to cleaning data. While cleaning a significant dataset that can be trimmed liberally is fairly straightforward (albeit laborious), creating missing values to overcome sparse or incomplete data is more complex.
It’s worth taking every opportunity to avoid handling missing values, as most methods for creating new data are limited in some way. However, imputing values is often better than dropping data because it’s incomplete.
Missing values (as well as anomalies, errors and outliers) can be identified and explored using unsupervised learning, particularly clustering. One of the easiest ways to handle missing values is simply drop (delete) rows and columns.
Before making any changes to your dataset, make sure you analyse your data with attention to the following three types of missing data:
Three Types of Missing Data
Missing data is not all the same and assuming so could be a fatal error!
There are three types of missing data:
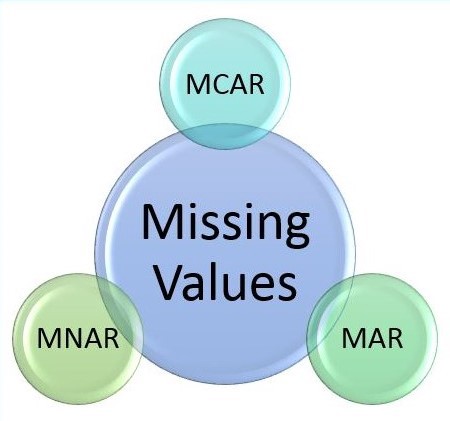
Missing completely at random (MCAR)
If missing data follows no discernible pattern within the missingness itself, it’s said to be MCAR. In this case, there’s nothing systematic about why that data is missing.
For example, if a weather dataset contains columns for rainfall, wind speed, etc, and a subset of values is missing completely randomly across all variables with absolutely no hint of a link between each missing value, they’re probably MCAR.
Missing at random (MAR)
Missing at random means the missing values are related to observed data, but not the missing data. So, there may be a hint of why the data is missing.
For example, if a person doesn’t attend an assessment because the person is ill, the attendance data may be predictable using other data about the person’s health.
Similarly, men may be less likely to respond to questions about their mental health than women due to being men. Therefore, maleness is a predictor of data that is MAR.
Missing not at random (MNAR)
Also called nonignorable data. This means the value of the missing variable is directly related to the reason why it’s missing. This differs from the above example in that, MNAR data would occur when the men who aren’t completing mental health surveys are doing so because of their mental health.
Another example would be when someone fails to disclose whether or not they took an illegal drug as they’re worried about legality. The ensuing missing value is not random.
Why Does This Matter?
Understanding why there is missing data in a dataset is implicit in exploring the relationships of data and any potential bias. Identifying why data is missing also enhances one’s own understanding of the data, and provides further avenues for data exploration, optimisation and research design.
Moreover, within reason, MCAR and MAR data can be interpolated and imputed from other values in the dataset. However, sometimes, determining the difference between MCAR and MAR is often only possible using substantive reasoning and not statistics. Therefore, caution must be exercised when identifying the cause of missing data where MAR and MNAR are possible explanations.
In some situations, imputing missing data is not suitable for the project/analysis. For example, when handling missing data in medical records, imputing data without analysing whether or not data is MCAR, MAR or MNAR can result in serious bias.
For example, imputing predicted male depression survey results because that data is deemed MCAR will neglect the fact this data is missing due to the individual’s mental health or related to some other observed data within the dataset.
Imputation Techniques
To handle missing values, it might be best to impute new values. Imputation shouldn’t be done at random, but the time and precision you apply will obviously depend on the project.
Hot Decking and Cold Decking
Hot decking and cold decking involve replacing missing values with records retrieved from inside or outside of the dataset. Hotdecking involves selecting and replacing the value from a record which is maximally similar to the missing record from within the same set. Cold decking replaces records with data taken from a similar dataset, such as replacing missing survey results from that of a previous survey.
These imputation techniques are popular for datasets that contain a lot of easily comparable data. For example, if the temperature is missing from a sensor’s data, but there’s a record for a sensor placed just metres away from it where the temperature is included, temperature data can be sensibly donated from one sensor to the other to form a complete dataset. This is an example of hotdecking.
If, however, the only comparable record is from last year’s readings, this would be cold decking, which is certainly not as robust/inferior to several other imputation techniques.
Median, Mean or Mode
Missing data in a set of continuous variables is relatively easy to impute via calculating the median or mean of the other variables in the set. Median is more robust when calculating missing values from a likely skewed dataset.
Median, mean or mode imputations are pretty reliable when dealing with MCAR data in simple datasets. This is because they take into account some of the range of the dataset, as well as the average values, to produce a ‘safe bet’ without being maximally accurate.
Forward Filling/Back Filling
Two common methods; forward filling means filling missing values with previous data, and backward filling means filling missing values with the next data point. Forward Filling should only be used when a target has been achieved. So, if an individual is recording their weight each week until they reach a target weight, at which point they stop, their weight can be carried forward for the remainder of the column.
Backfilling is used when missing data is uncovered in the past. So, if you knew an employer didn’t give a raise to their employees as they weren’t at work (e.g. they were off work due to the COVID19 pandemic), then the previous year’s salary can be filled in with this year’s salary.
Use an Algorithm or Model: Expectation-Maximization and Regression or Classification Models
A classic algorithm for processing data, expectation-maximization does what it says on the tin. The algorithm uses variables to impute a value (Expectation), then checks whether that value is the value most likely (Maximization). This is repeated iteratively.
It’s also possible to use a regression or classification model to predict the missing value(s). This may be advantageous for complex high-dimensional, high-variance datasets where missing values are critical to the project’s overall success.
It’s worth bearing in mind that some algorithms function with a limited quantity of missing values if you’re trying to add missing values for machine learning. For example, k-NN algorithms can ignore a column when a value is missing, and Naive Bayes can miss values when making predictions.
Handling Missing Unstructured Data
While handling missing structured data is often possible at least, handling unstructured data can pose a different challenge.
For example, suppose you’re training an autonomous vehicle, but if you realise you don’t have enough footage of driving in the snow. Or, perhaps more realistically, suppose you’re training an object classification model but don’t have enough image data across certain classes.
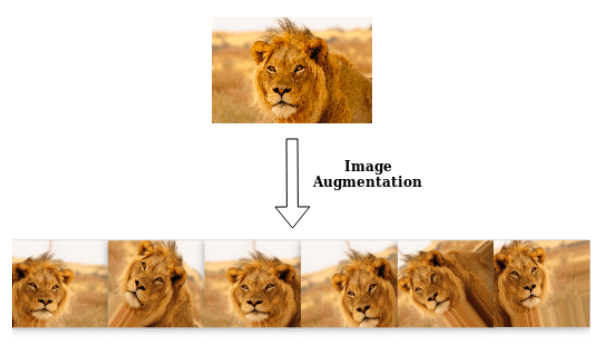
In these situations, you’re better off enlarging your dataset using data augmentation. You can also simply collect more data manually, or could even generate data using a synthetic data generator like Nvidia’s Omniverse Replicator.
Data augmentation for images and video involves flipping, cropping, mirroring and otherwise manipulating data to multiply your data, as we can see from the cat example below. This gives computer vision (CV) models more data to learn from, thus improving their accuracy. Tensorflow is one of the go-to tools for data augmentation.
Summary: How To Clean And Process Data
Learning how to clean data is vital for all manner of data-centric and data-related fields and disciplines. Data quality should never be taken for granted – assuming that your data is ready to use without checking it is extremely risky!
Data cleaning and processing can be straightforward in the case of small, continuous value datasets or very complex in the case of high-dimension, high-variance datasets. Python libraries like Panda are excellent for structured data manipulation.
A step further than data cleaning is handling missing values. Missing values should be treated with caution if you don’t know exactly why they’re occurring – get the bottom of that first.
While quick and dirty techniques for imputing missing data like averaging, forward filling, backfilling, hot decking and cold decking are safe enough for many projects, these techniques should be exercised with care when dealing with sensitive or project-critical data.